 Getting started
Connecting a new channel — WhatsApp and Telegram
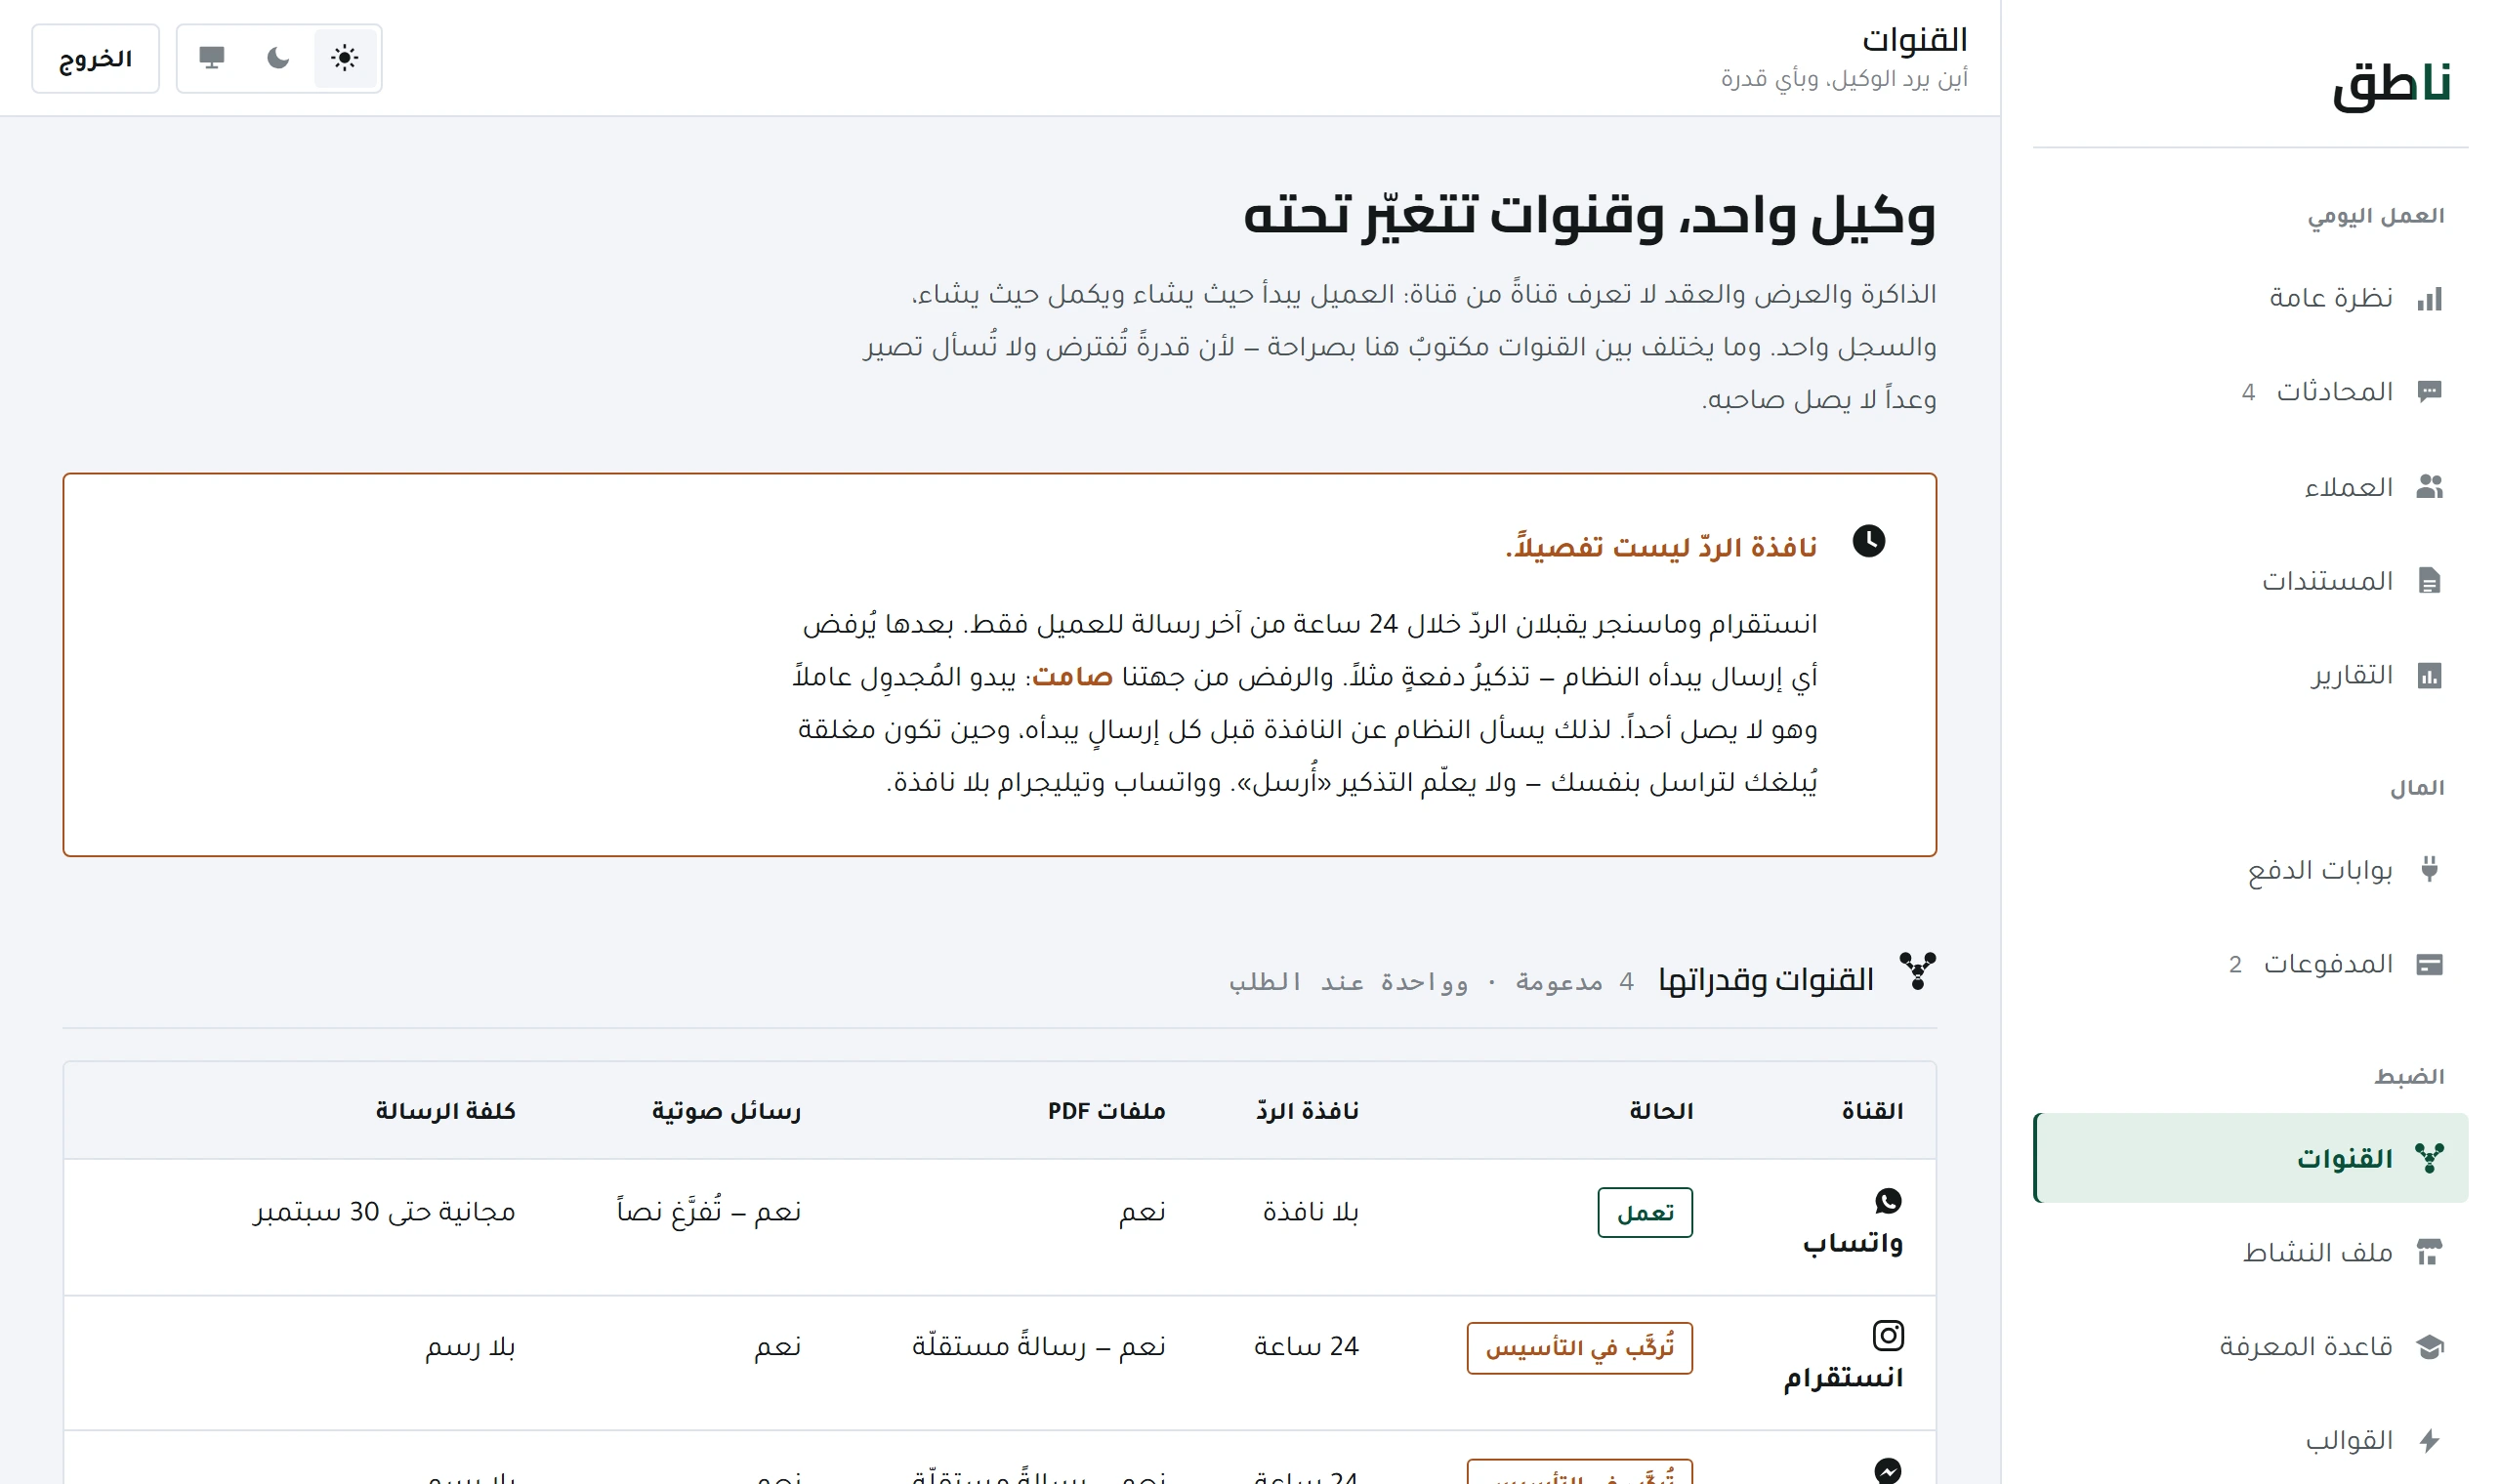
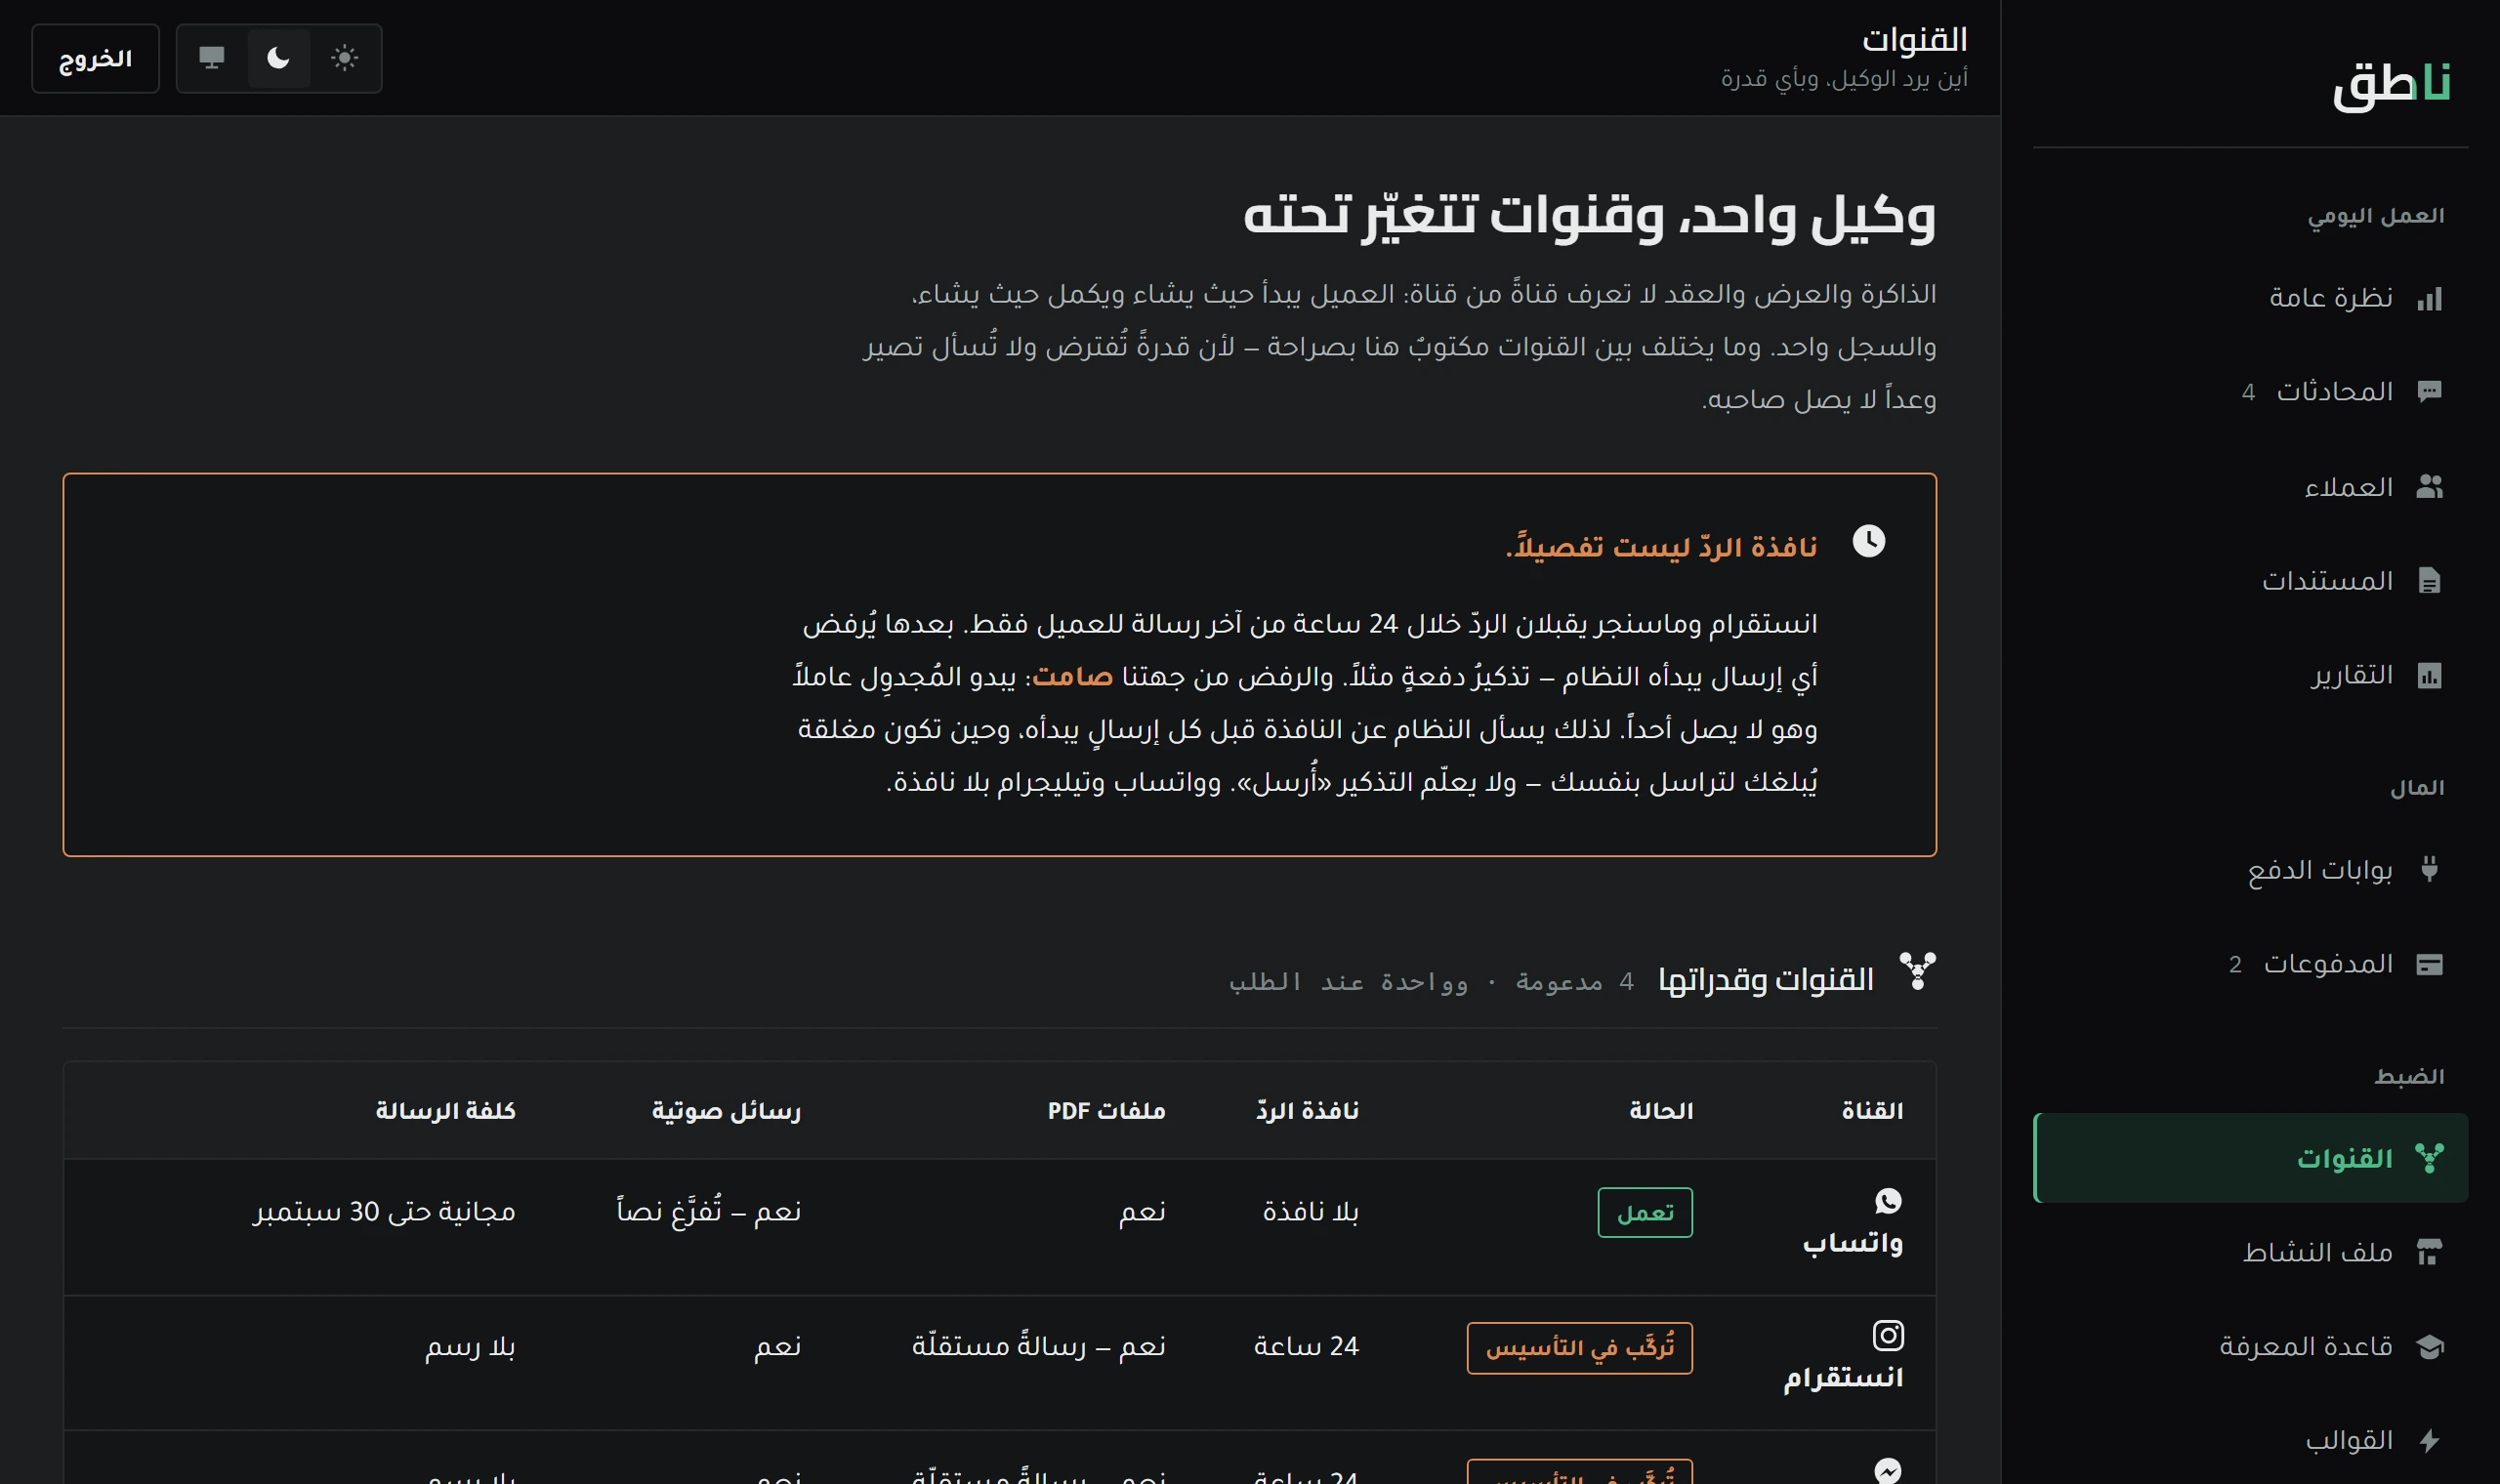
Every channel is its own row with its own status and keys. What each one needs, and why Instagram and Messenger do not open at the press of a button.
6 minOpen lesson
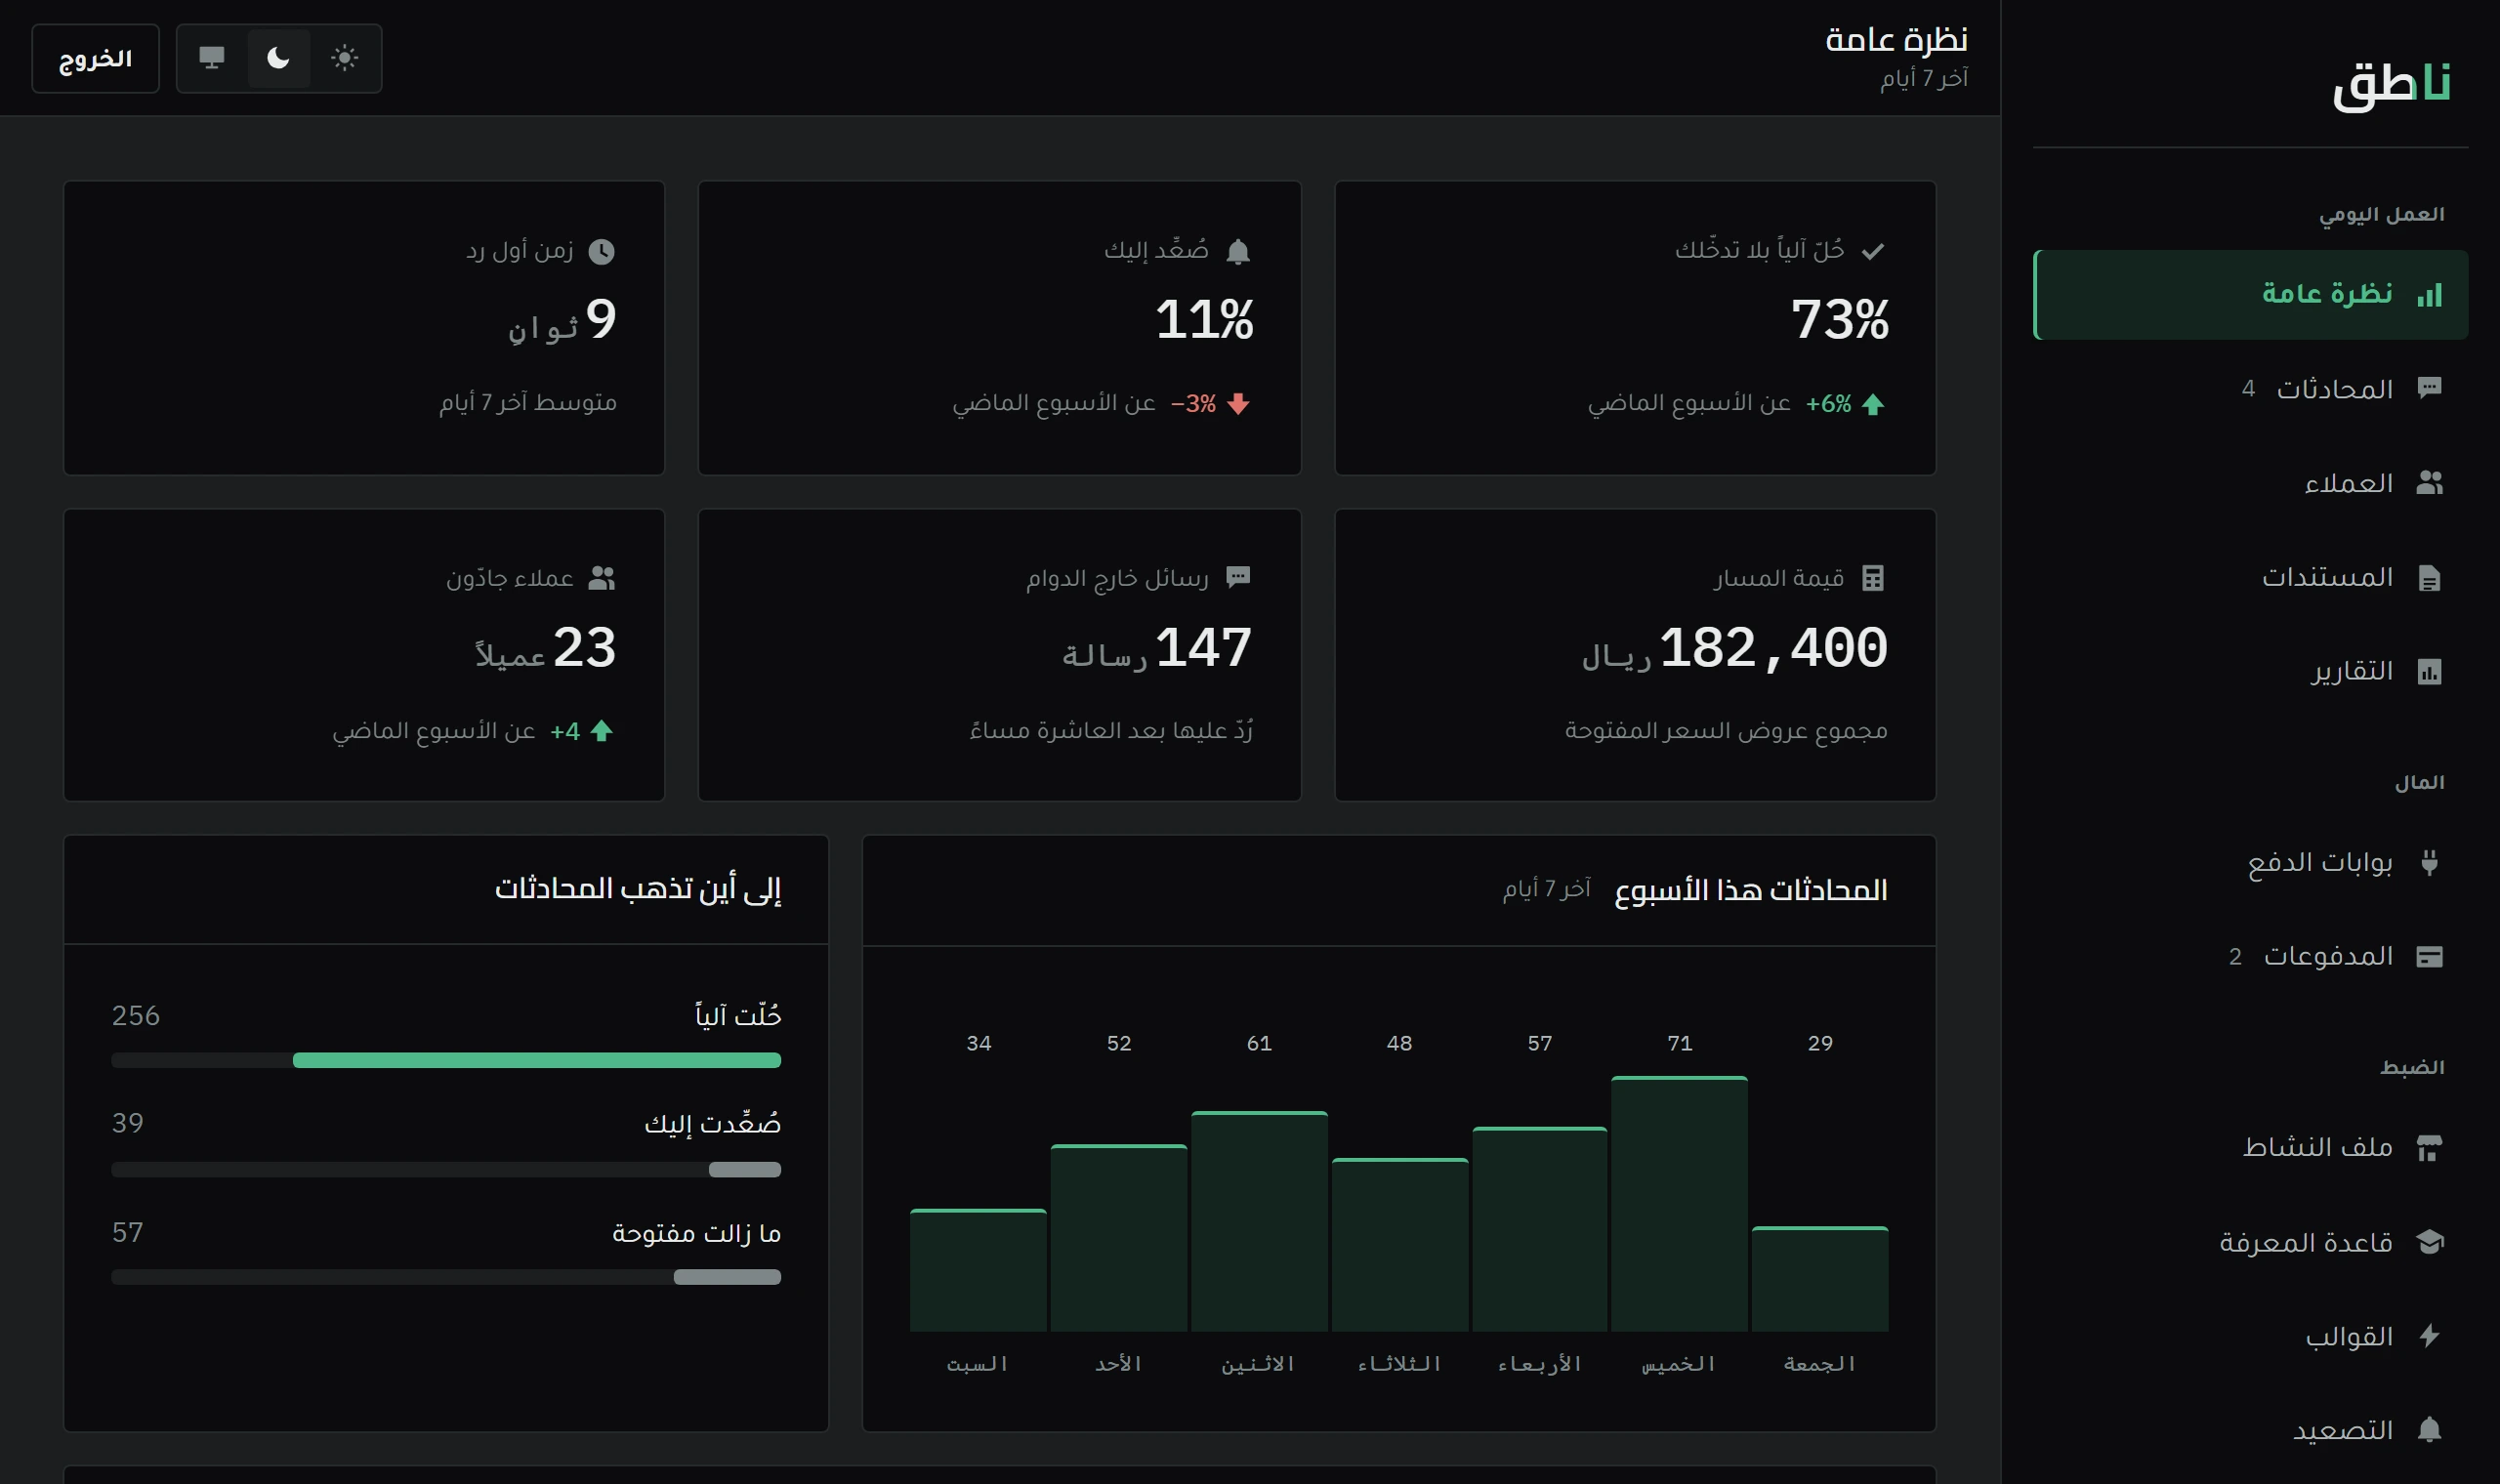
Four numbers at the top of the dashboard carry your first week: automated resolution rate, escalation rate, first-reply time and pipeline value.
Getting started · 5 min read
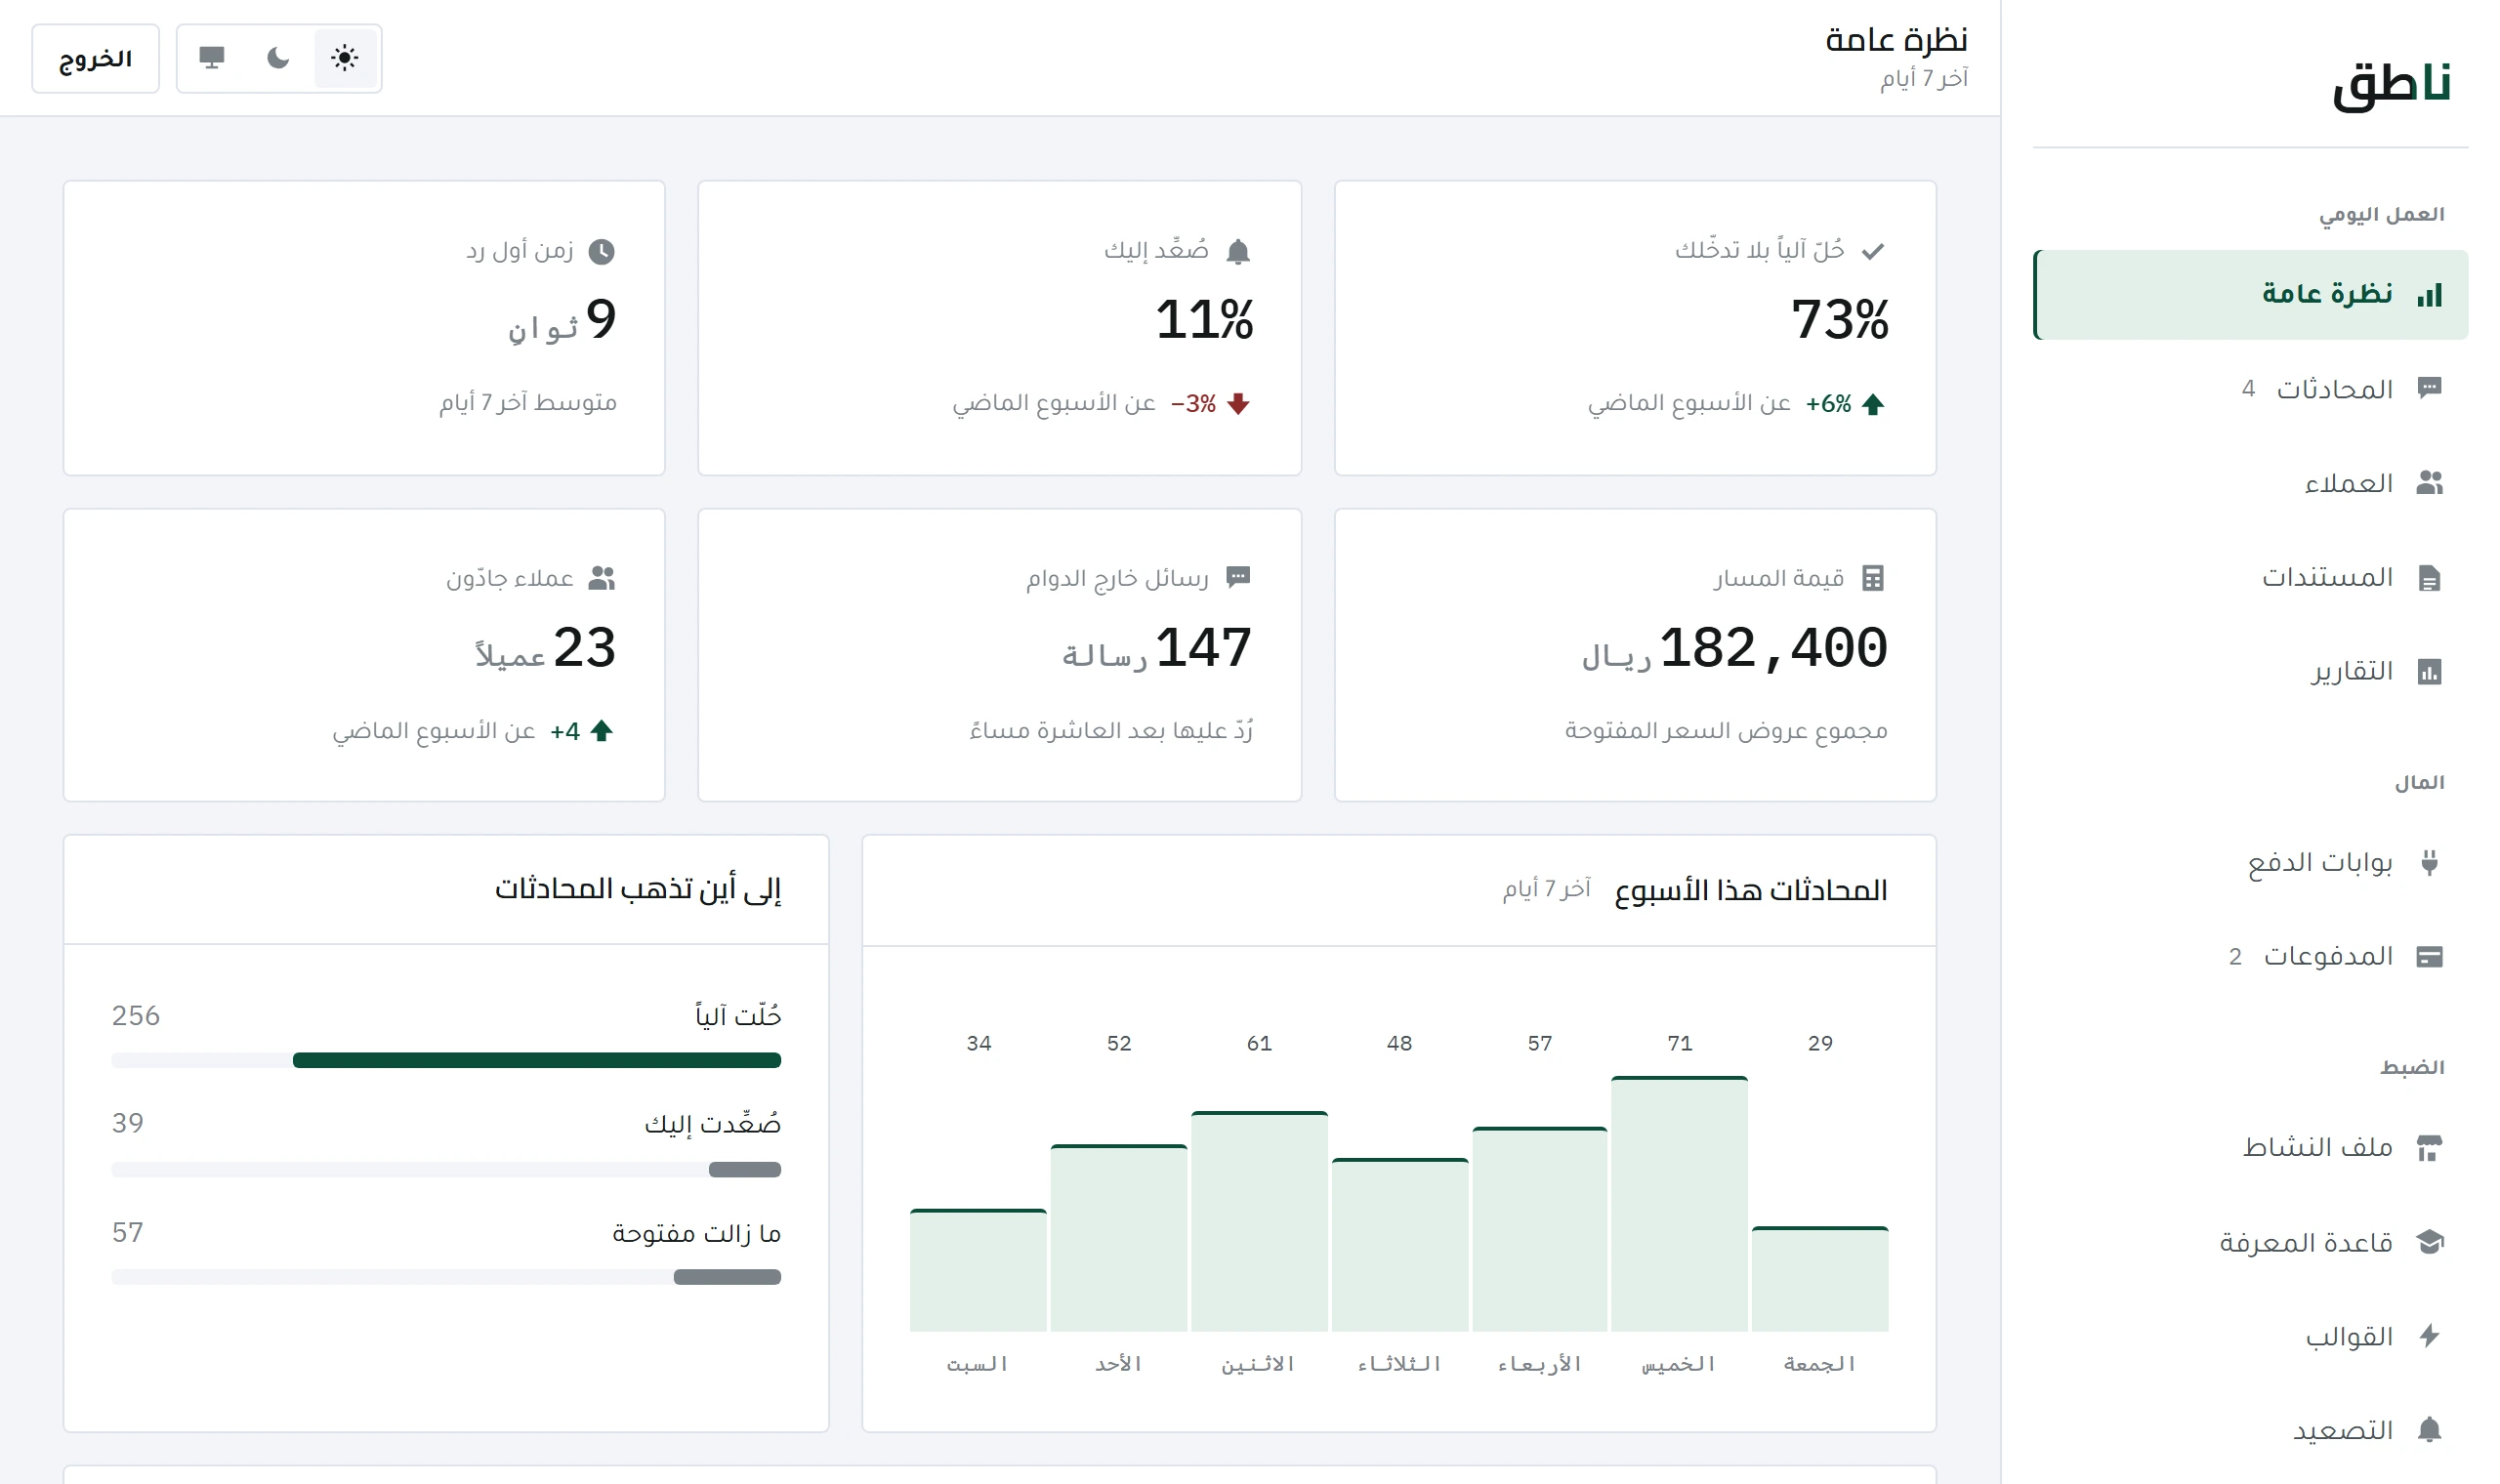
The first time you open the dashboard you will see four numbers along the top and a curve beneath them. These four are not dashboard decoration — each answers a question you ask yourself in your first week, and three of them move fast.
This lesson tells you what to look at, when the numbers start to mean something, and which single number is worth acting on from day one.
In the first week do not chase the resolution rate — chase the reasons for escalation. The first is an outcome; the second is what you can fix today.
| Number | Answers the question | When to worry |
|---|---|---|
| Automated resolution rate | How many conversations closed without you? | Not early on — it needs a sample |
| Escalation rate | How often did the system come up short and call you? | When it stays high after two weeks |
| First-reply time | How long did the customer wait for a first word? | When it exceeds a few seconds |
| Pipeline value | How many riyals sit in quotes not yet closed? | When it does not move for a full week |
And the escalation rate is the only one directly fixable — the lesson that explains it is escalation rules.
Not the numbers — the conversations themselves. Ten are enough to see with your own eyes where the system answers well and where it stumbles.
That is your to-do list. Every line in it is a missing knowledge entry, not a fault in the system.
A change does not show its effect immediately — it shows only in the conversations that follow it.
A day is a small sample that swings on one conversation, so the system looks erratic when it is steady.
Usually it means conversations are few and their questions easy, or that the system is answering questions it should have escalated. A system that «always answers» is more dangerous than one that hands over a lot — because the second annoys you, and the first annoys your customer without you knowing.
And once the picture settles, the next step is building the knowledge base — it is what moves all four of these numbers the most.
The escalation rate. It tells you how often the system came up short and handed over to you — and it being high in the first week is normal: it means the knowledge base is incomplete, not that the system is broken. Every escalation is a question worth adding.
After roughly a hundred real conversations. Before that the sample is too small to decide on — a figure drawn from ten conversations swings ten percent on a single one.
Getting started
Every channel is its own row with its own status and keys. What each one needs, and why Instagram and Messenger do not open at the press of a button.
 Tuning and quality
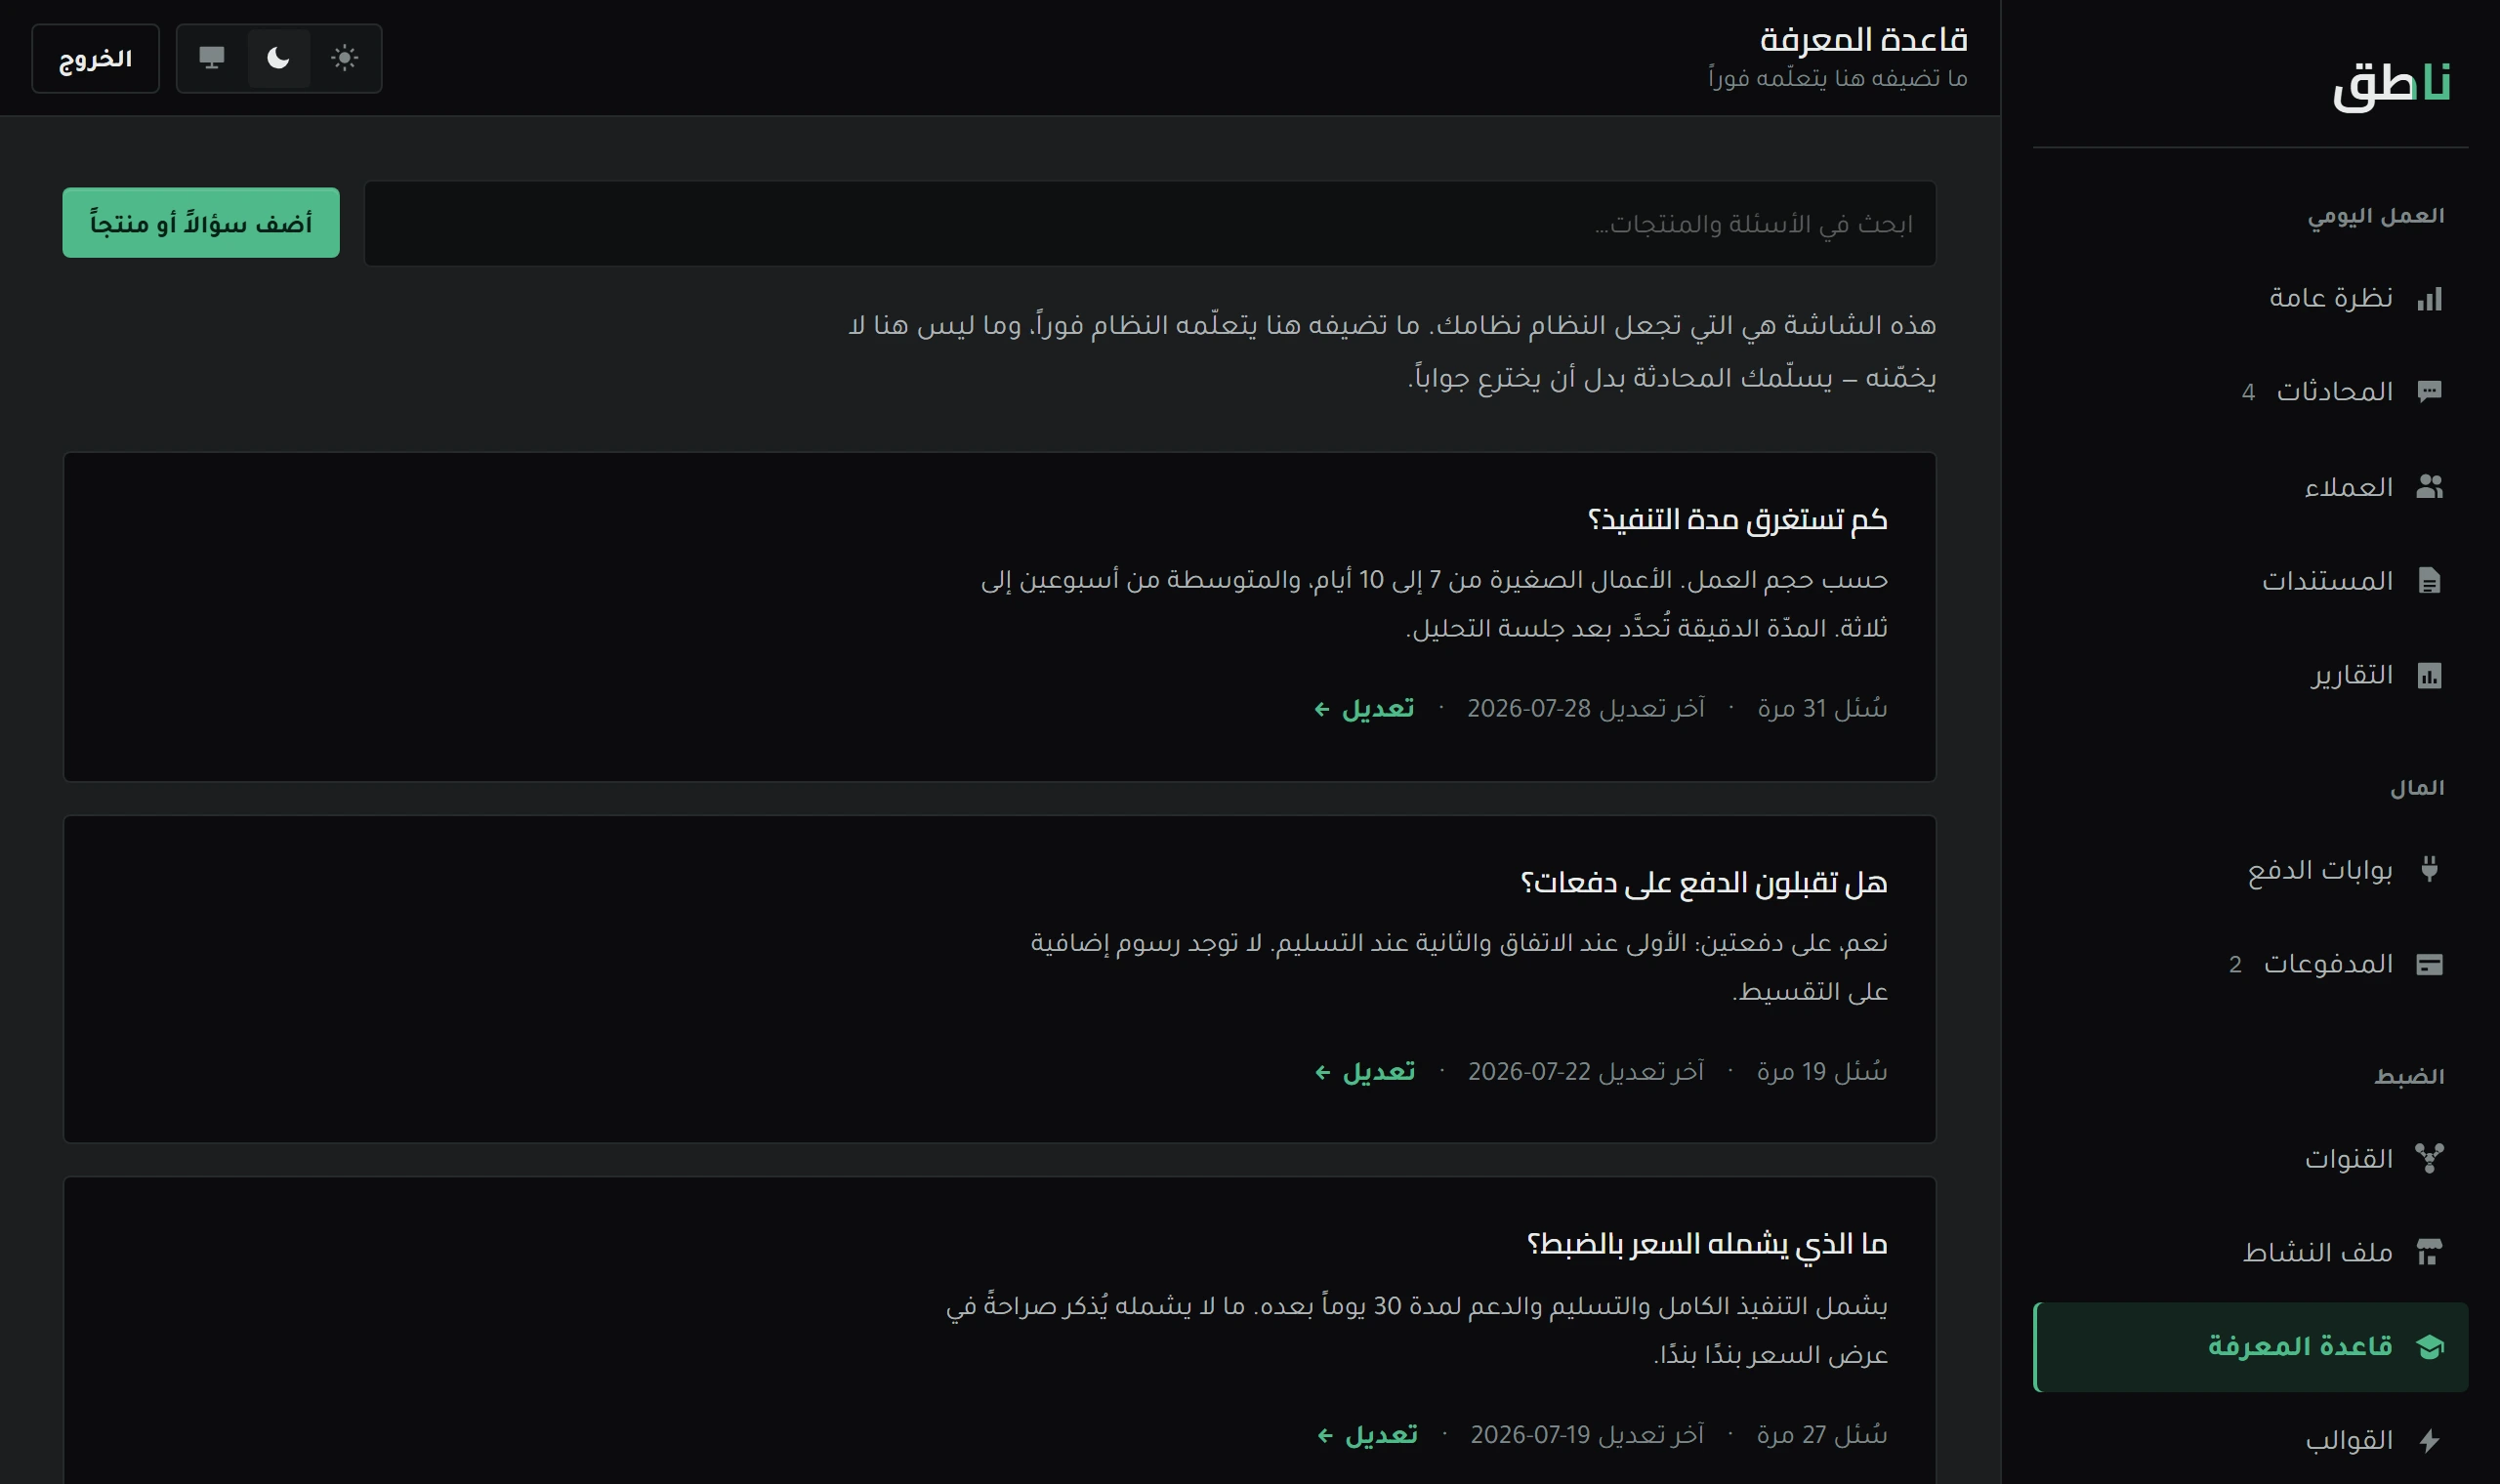
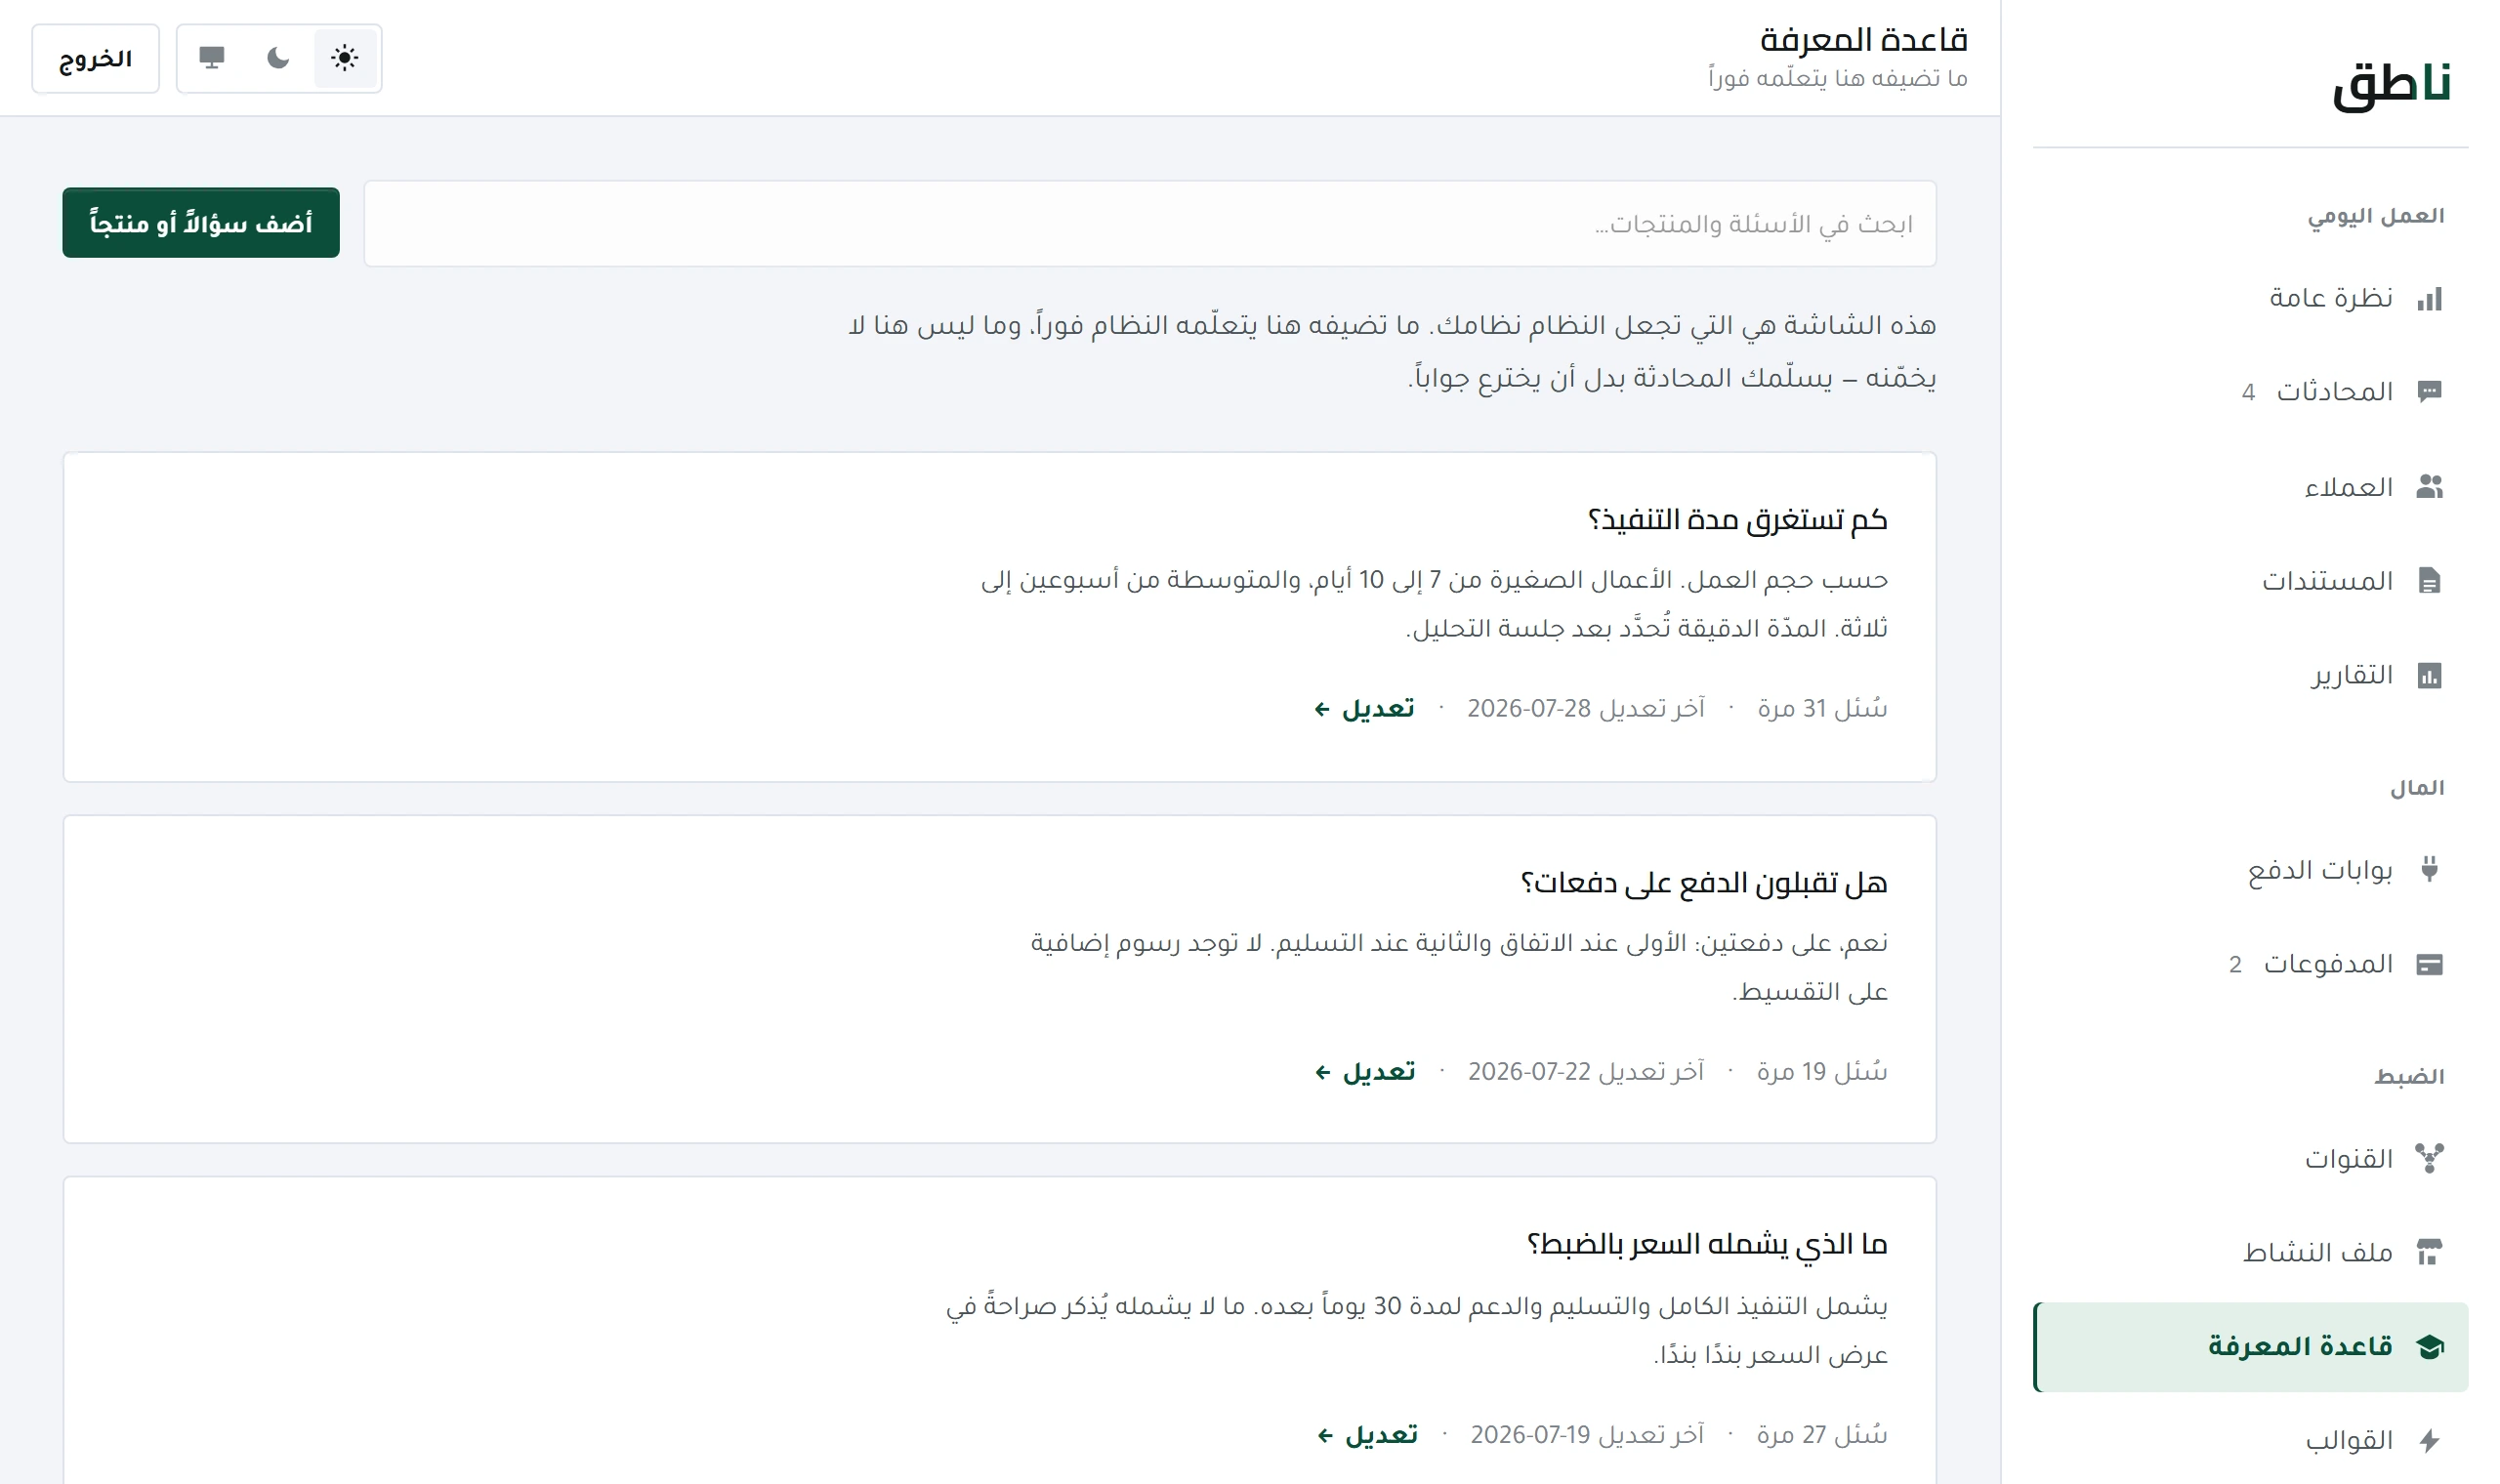
What determines reply quality most is not the model but what it knows about your business. How to write an entry, and what must never go in here.